 1
 2
 3
 4
 5
 6
 7
 8
 9
10
11
12
13
14
15
16
17
18
19
20
21
22
23
24
25
26
27
28
29
30
31
32
33
34
35
36
37
38
39
40
41
42
43
44
45
46
47
48
49
50
51
52
53
54
55
56
57
58
59
60
61
62
63
64
65
66
67
68
69
70
71
72
73
| import matplotlib.pyplot as plt
plt.subplot(nrows, ncols, index)
```python
# 创建子图
plt.figure(figsize=(10, 6))
```python
import matplotlib.pyplot as plt
import numpy as np
# 创建数据
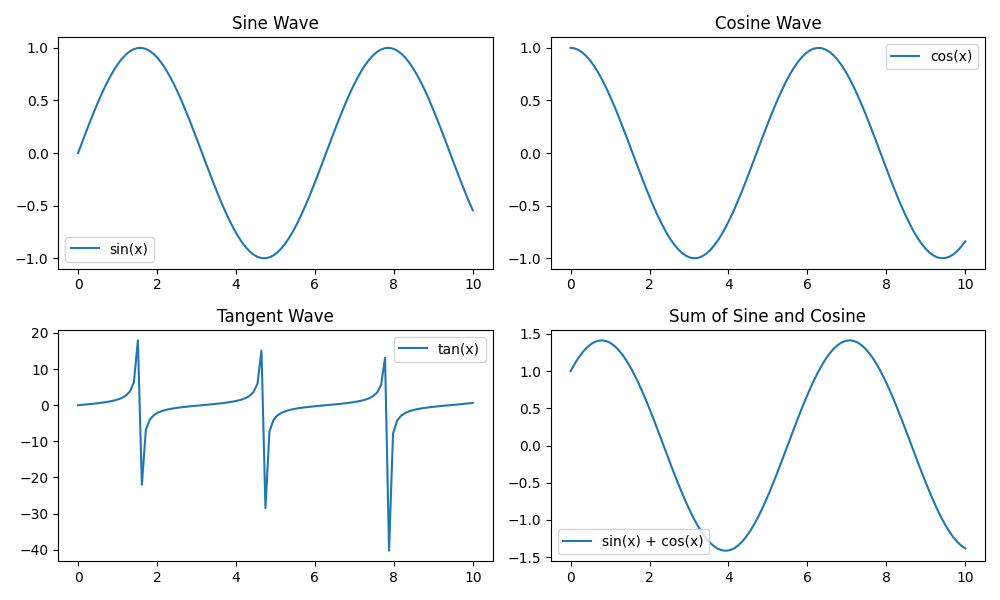
x = np.linspace(0, 10, 100)
y1 = np.sin(x)
y2 = np.cos(x)
y3 = np.tan(x)
# 创建子图
plt.figure(figsize=(10, 6))
# 第一个子图
plt.subplot(2, 2, 1) # 2行2列的第1个
plt.plot(x, y1, label="sin(x)")
plt.title("Sine Wave")
plt.legend()
# 第二个子图
plt.subplot(2, 2, 2) # 2行2列的第2个
plt.plot(x, y2, label="cos(x)")
plt.title("Cosine Wave")
plt.legend()
# 第三个子图
plt.subplot(2, 2, 3) # 2行2列的第3个
plt.plot(x, y3, label="tan(x)")
plt.title("Tangent Wave")
plt.legend()
# 第四个子图
plt.subplot(2, 2, 4) # 2行2列的第4个
plt.plot(x, y1 + y2, label="sin(x) + cos(x)")
plt.title("Sum of Sine and Cosine")
plt.legend()
# 显示图形
plt.tight_layout() # 自动调整子图间距
plt.show()
```python
import torchvision.utils as vutils
# 将图片制作成网格
grid_img = vutils.make_grid(x, nrow=4, padding=2)
# 可视化网格图片
plt.figure(figsize=(10, 10))
plt.imshow(grid_img.permute(1, 2, 0)) # 调整通道顺序以适应 matplotlib 的要求
plt.axis('off')
plt.show()j
```Creating subplots for image browsing offers great flexibility, but I often forget how to use them. I’m writing this blog specifically to reinforce my memory.
## Drawing Subplots
First, to draw a subplot at a certain position, you need to call the `plt.subplot` method.
They represent the row, column, and subplot index, respectively. I often used to forget that the index refers to the subplot number.
Before drawing subplots, you must first create them.## Example
Next, here is a complete example.### Preview
If you want to view images with a shape of (32, 1, 192, 32), you can also use the utility functions provided by torchvision.
|
