语速
创建子图来进行图像浏览,灵活性很强,但是经常忘记怎么用,这里特意写一个博客,来强化一下记忆。
绘制子图
首先,在某个位置绘制子图,需要调用 plt.subplot 方法。
| |
分别是行列以及子图编号。我之前经常不记得 index 是子图编号。
在绘制子图之前,首先要创建子图。
| |
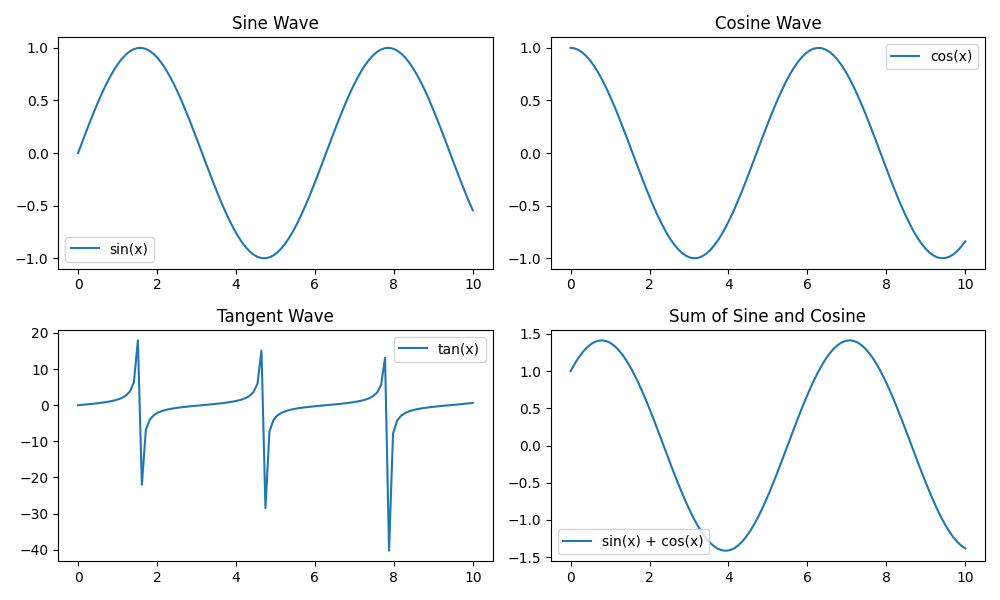
例子
接下来, 是一个完整的例子。
| |
效果图
如果想要查看 (32, 1, 192, 32) shape 的图像,实际上还可以使用 torchvision 提供的工具函数。
| |
创建子图来进行图像浏览,灵活性很强,但是经常忘记怎么用,这里特意写一个博客,来强化一下记忆。
首先,在某个位置绘制子图,需要调用 plt.subplot 方法。
| |
分别是行列以及子图编号。我之前经常不记得 index 是子图编号。
在绘制子图之前,首先要创建子图。
| |
接下来, 是一个完整的例子。
| |
如果想要查看 (32, 1, 192, 32) shape 的图像,实际上还可以使用 torchvision 提供的工具函数。
| |